Let’s get visual! Visual!
Let me see your statistics talk
- 28th November
When visualised correctly, words are no longer just words, numbers are no longer just numbers, and your brand starts to truly tell a story.
Whether you’re explaining a new product, breaking down some key stats, or simply creating presentation slides to blow your audience away, visualisation is a vital piece of the puzzle. The value of having your brand’s critical information presented in an easily understandable, visually appealing way cannot be underestimated.
So, what is a visualisation?
That’s a pretty broad question with a potentially very broad answer.
Essentially, it’s any medium that relies on using visuals to help communicate a key idea. Everything from infographics and demonstration videos, to YouTube cooking videos and social media memes, can all fall under the umbrella of visualisation. They all make use of visuals to communicate their message quicker than they would with text alone.
While we’re yet to shoot a cooking video (although we’re now pondering all the ways to loop cooking back into IT and technology content) we’re experts in helping our customers find the right visual format for them, whipping up something special, and then getting it in front of the right people. Here’s some of the stuff we’ve been working on lately:
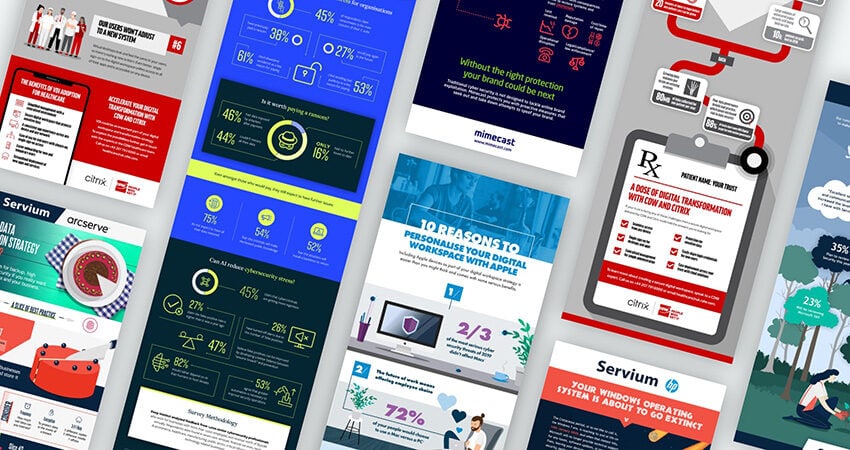
All-in for infographics
Infographics are the bread and butter of visualisations, especially in the B2B world. And it’s for good reason! They’re incredibly adaptable, easy to get out to your audience, and great for communicating the value of a product, service, or even the value proposition of an entire business.
We’ve produced infographics in all shapes and sizes, taking longform breakdowns of stats (unavoidable yawnfests) and shaping them into snappy, informative visuals. All the infographics we’ve created share a few common traits – they’re clear, coherent, and easily digestible.
We like to say that any good infographic is read twice by its audience:
- First, it’s a quick, cursory, at-a-glance view. Depending on how the infographic is delivered, your audience may quickly take in at the full visual, or focus in on a particularly eye-catching snippet. Either way, it needs to be interesting enough to convince a viewer that it’s worth their time to probe deeper, or, at the very least, give them the top takeaways they need to remember.
- The second read is a more considered, in-depth look. The best infographics work almost like a comic book; using visuals to give context to the information alongside it, so that the two work together in harmony.
Finding that harmony is critical. Picture this: you’re reading some stats about how a product can improve a key business outcome. Right next to it is an image of an elephant wearing a top hat. The stats are important information, but your brain is distracted – it’s too busy trying to work out how the stats relate to an elephant to let them sink in. And what’s with the top hat? The novelty of it is great for helping something stick in your audience’s mind, but they’re going to be remembering the wrong bit.
Successful infographics find that harmony, presenting novel and impactful visuals. That’s the approach we take, and it’s helped us produce effective infographics that communicate their message in a fraction of the time it’d take to process the same information through text alone.
Lights, camera, Asgard!
The old adage says that a picture is worth 1,000 words – which, by extension, means a video delivered at 30 frames per second comes out at 30,000 words every second. That’s before even factoring in a voiceover! But maths aside, we’ve said it once and we’ll say it again – video is one the most effective ways to raise your profile amongst an audience.
There are endless ways to use video to promote a message. Whether through methodical product demos, or a snappy animated explainer, video has the incredible ability to stick in the minds of its viewers.
Video is an intensely sharable format, but it doesn’t have to go viral to be a success, and the best videos aren’t necessarily the most widely shared. Think about it – you’re probably not in a hurry to send an animated explainer about a product to your work group chat, but somewhere down the line if you need to explain that product to someone else, chances are one of the first steps you take will be sending them the YouTube link. This creates a chain of shares, where the person you show the video to will then send that video to the next person who asks them, and so on. Your video may not reach the widest audience, but it’s doing something better – being seen by the right audience.
When it comes to producing video content, the most important thing is that it cements your brand – even if viewers don’t remember all the technical details, they’ll know whose video they were watching, and will come back to you again to refresh their memory.
What’s next?
From something as simple as a social card, to a full-fledged video, making things visual means making them memorable – and making sure your brand sticks in people’s memories is at the core of what we do.
Whether you want to put together an infographic, a pitch deck, or even give us the chance to shoot that cooking video, we’re here to help. And if you’ve got the content, but you’re not sure what exactly you want to create, we can help find the best medium for you.
Or, if you’re finding it tough to clarify what messaging you want to take out to your audience, our value proposition design workshops help distil the concepts at the very heart of your product, service, or your brand as a whole.
Wherever you are in the journey, we’ll help you get on your way to creating impactful, engaging visual content that doesn’t just get you noticed – it gets you remembered.
Since joining us, Izzy has been getting stuck into our visualisation projects - and we're loving having her around!